

You’ve tried explaining that testing catches bugs before they reach customers. You’ve shown defect counts and test coverage percentages. The response is still the same: “That’s nice, but what’s the business case?”
The ROI of testing is the answer. When you can demonstrate that every dollar invested in QA saves $4 to $10 in avoided failures, stakeholders listen.
This guide gives you a practical framework to prove the ROI of testing using data, metrics, and business-aligned language. You’ll learn the 5 metrics that stakeholders actually care about, how to calculate the ROI of testing, and exactly what to say in your next meeting.
The Short Answer
The ROI of testing is extraordinary: a bug caught in development costs ~$10 to fix; the same bug found by a customer costs ~$1,000 or more. Every dollar invested in QA saves $3.50 to $4.45 in avoided failures. To prove the ROI of testing, use the Cost of Quality (CoQ) framework and track 5 key metrics: Defect Leakage Rate, Cost of Quality, ROI of Automation, Mean Time to Repair, and Business Risk Coverage. Present these in business terms to convince stakeholders that QA is a strategic investment, not a cost center.
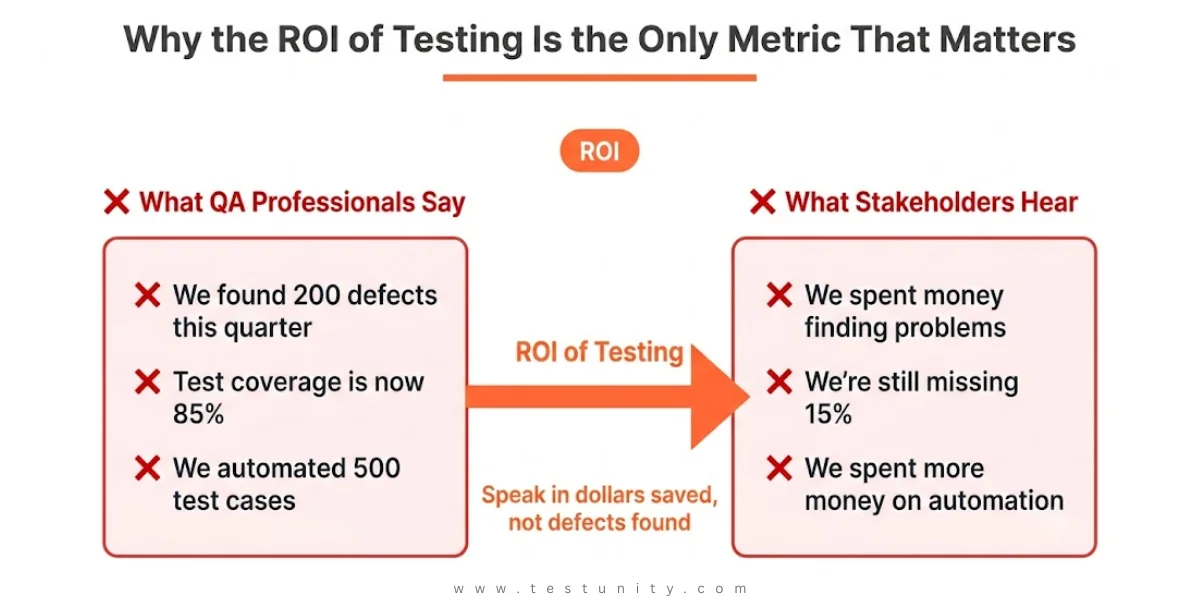
Why the ROI of Testing Is the Only Metric That Matters
The disconnect between QA and stakeholders isn’t about the value of quality – it’s about communication.
What QA Professionals Say
-
“We found 200 defects this quarter.”
-
“Test coverage is now 85%.”
-
“We automated 500 test cases.”
What Stakeholders Hear
-
“We spent money finding problems.”
-
“We’re still missing 15%.”
-
“We spent more money on automation.”
The ROI of testing bridges this gap. When you speak in dollars saved, risk reduced, and revenue protected, you speak the language of business.
The Economics of Software Quality: Proving the ROI of Testing
The Cost of Quality Framework
The Cost of Quality (CoQ) framework breaks quality costs into four categories:
| Category | Definition | Examples |
|---|---|---|
| Prevention Costs | Activities to prevent defects | Training, design reviews, coding standards, static analysis |
| Appraisal Costs | Evaluating quality | Test design, test execution, code inspections |
| Internal Failure Costs | Defects found before release | Debugging, rework, retesting, failed CI builds |
| External Failure Costs | Defects found after release | Customer support, hotfixes, lost revenue, reputation damage |
The central insight: internal failure costs are dramatically lower than external failure costs – typically one to two orders of magnitude.

The ROI of Testing: Real Numbers
Capers Jones, a pioneer in software quality economics, documents the staggering cost differential of finding bugs at different stages.
Scenario A: No Formal Testing
-
250 defects caught during development: $10 each
-
750 defects escape to customers: $1,000 each
-
Total cost: $752,500 per release
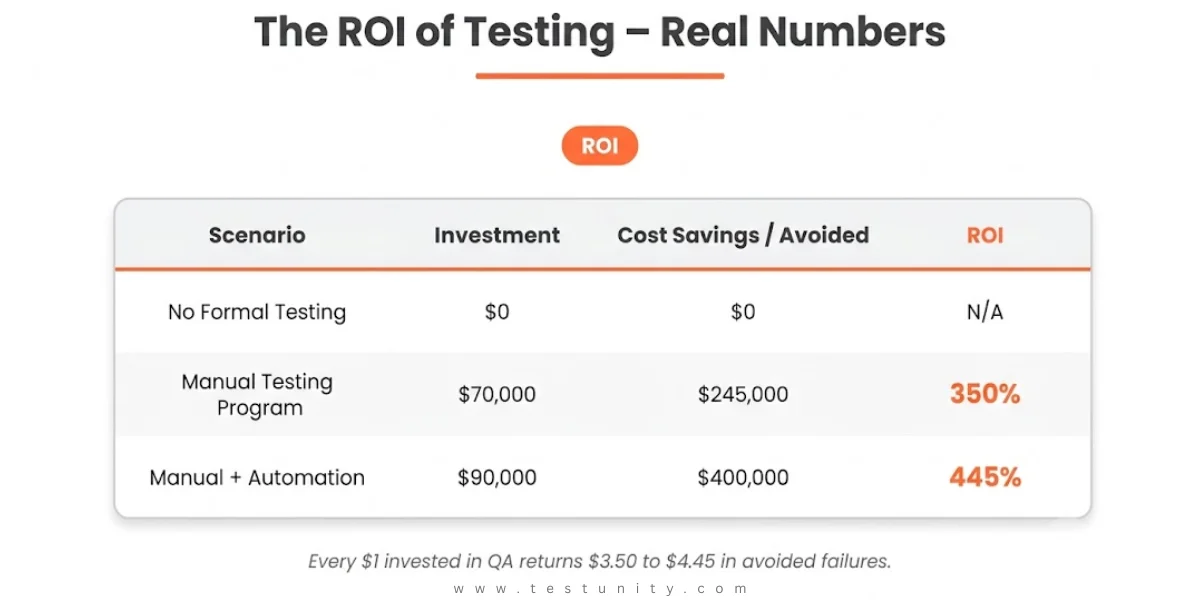
Scenario B: Manual Testing Program
-
Invest $70,000 in manual testing
-
Catch 350 additional defects at $100 each
-
External escapes drop to 400
-
ROI: 350%
Scenario C: Manual + Automation
-
Invest $90,000 in a blended program
-
Catch 380 additional defects
-
ROI: 445%
The ROI of testing is not just positive – it’s extraordinary. Every dollar invested in QA returns $3.50 to $4.45 in avoided costs.
5 Metrics to Prove the ROI of Testing to Stakeholders

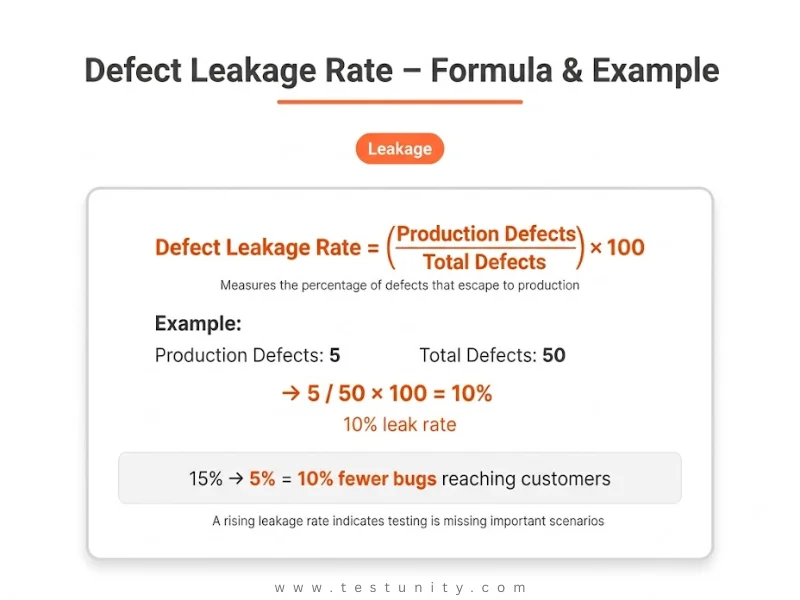
Metric 1: Defect Leakage Rate
What it measures: Percentage of defects that escape to production.
Formula:
Defect Leakage Rate = (Defects found in Production / Total Defects Found) × 100
How to present it:
“Our defect leakage rate dropped from 15% to 5%. That means 10% fewer bugs reaching customers. Based on our cost-of-quality analysis, that’s $X avoided in support costs.”
 Metric 2: Cost of Quality (CoQ)
What it measures: Total quality-related costs as a percentage of development budget.
Formula:
CoQ = Prevention + Appraisal + Internal Failure + External Failure Costs
How to present it:
“We spent $90,000 on testing this quarter. We saved $400,000 in avoided failures. That’s a 445% ROI of testing.”
Metric 3: ROI of Automation
What it measures: Return on investment for test automation.
Formula:
ROI = (Manual Execution Cost × Number of Cycles) – (Automation Setup + Maintenance Cost) / (Automation Setup + Maintenance Cost)
Example:
-
Manual regression: 10 hours × 12 cycles = 120 hours × $75/hour = $9,000
-
Automation setup: 80 hours × $75/hour = $6,000
-
Maintenance: 5 hours/cycle × 12 = 60 hours × $75/hour = $4,500
-
Year 2 ROI: 75%

Metric 4: Mean Time to Repair (MTTR)
What it measures: How quickly defects are fixed after detection.
How to present it:
“We reduced MTTR from 5 days to 2 days. We fix critical bugs 60% faster, reducing business impact.”
Metric 5: Business Risk Coverage
What it measures: Test coverage connected to critical business processes.
How to present it:
“We’ve achieved 95% test coverage for checkout and payment flows – the revenue-critical parts of the application.”
How to Build Your Business Case to Convince Stakeholders
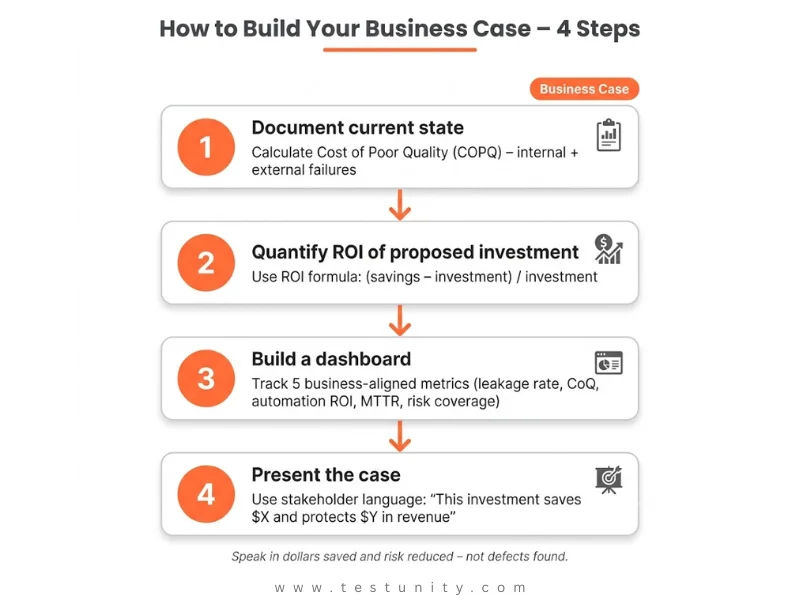
Step 1: Document Your Current State
Calculate your current Cost of Poor Quality using the formula:
COPQ = Internal Failure Costs + External Failure Costs
| Cost Category | How to Calculate |
|---|---|
| Internal failures | Time fixing bugs before release × developer salary × hours |
| External failures | Support tickets × support cost + hotfix hours + estimated lost revenue |
Step 2: Quantify the ROI of Proposed Investment
ROI of testing formula:
ROI = (Cost savings from prevented failures + Reduced manual testing cost) / (Test tool + people + infrastructure cost)
Step 3: Build a Dashboard with Business-Aligned Metrics
Show stakeholders these metrics:
-
Defect leakage rate
-
Cost of quality (trends over time)
-
ROI of automation
-
Mean time to repair
-
Business risk coverage
Step 4: Present the Case in Stakeholder Language
Template presentation structure:
-
The Problem: Here’s what poor quality is costing us right now
-
The Solution: Here’s the proposed investment in QA
-
The ROI of Testing: Here’s the projected return
-
The Risk: Here’s what happens if we don’t invest
Quick Reference: The Stakeholder Pitch
| Stakeholder Concern | Your Message |
|---|---|
| “QA is too expensive.” | “The ROI of testing is proven: up to 10x return on investment.” |
| “We can’t afford to slow down.” | “QA accelerates delivery by catching defects early, when they’re cheap to fix.” |
| “Our users are happy.” | “One major incident can undo years of trust. The ROI of testing is protecting that trust.” |
| “We’ll fix bugs later.” | “A bug fixed in production costs 100x more than a bug caught in development.” |

Related Resources
-
Essential Test Metrics and KPIs – Metrics that demonstrate QA value
-
Risk-Based Testing: Prioritizing QA Efforts – Risk as business language
-
Test Automation Strategy: How to Plan, Execute, and Scale – Build the business case for automation
-
Testing Anti-Patterns: Common Mistakes That Ruin Test Suites – Fix costly testing mistakes

TestUnity is a leading software testing company dedicated to delivering exceptional quality assurance services to businesses worldwide. With a focus on innovation and excellence, we specialize in functional, automation, performance, and cybersecurity testing. Our expertise spans across industries, ensuring your applications are secure, reliable, and user-friendly. At TestUnity, we leverage the latest tools and methodologies, including AI-driven testing and accessibility compliance, to help you achieve seamless software delivery. Partner with us to stay ahead in the dynamic world of technology with tailored QA solutions.



Leave a Reply